
The Ishikawa Diagram, also known as the fishbone diagram or cause-and-effect diagram, is a visual tool used to identify, organize, and analyze the possible causes of a problem.
Created by Kaoru Ishikawa in the 1960s, the method is widely used in quality, engineering, and continuous improvement to investigate production failures, testing defects, yield losses, and non-conformities.
🎯 Diagram Objective
Identify all potential causes that contribute to a central problem, structuring the analysis by categories and assisting in precise diagnosis.
🧠 Structure of the Ishikawa Diagram
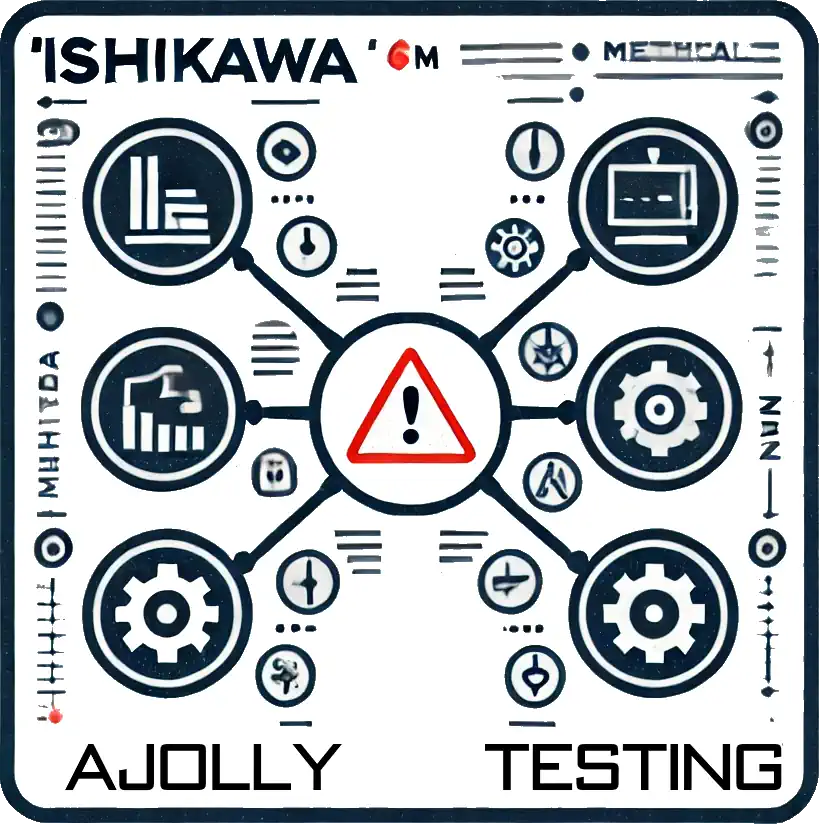
The problem to be analyzed is placed at the “head” of the fish, and the main “bones” represent the categories of causes. Secondary causes are branches of these categories.
The 6 classic categories (6M):
| Category | Application in test systems |
|---|---|
| Machine | Test equipment, instruments, jigs, sensors |
| Method | Test procedure, sequence, logic, parameterization |
| Measurement | Uncertainties, poorly defined tolerances, calibration |
| Labor | Operator training, execution error, supervision |
| Material | Defective product, contaminated batch, supply variation |
| Environment | Temperature, noise, vibration, lighting, ESD |
🔍 Typical Applications of Ishikawa with AJOLLY Testing
- Analysis of repetitive test failures (Top Failures)
- Diagnosis of variations in measurements or yield (FPY low)
- Investigation of communication, performance, or software issues
- Review of incidents with damaged equipment or expired calibration
- Support in corrective actions (8D, PDCA, Kaizen)
🔧 How AJOLLY Testing Uses the Ishikawa Diagram
AJOLLY Testing applies the Ishikawa diagram as an integrated tool in projects of test engineering, quality analysis, and development of robust solutions.
🛠️ Integration with Technical Data
- Automatic generation of diagrams based on recorded test failures
- Association with serial data, operator, station, equipment, and firmware
- Interactive visualization of causes grouped by product line
📊 Support for Problem Solving
- Use of Ishikawa in conjunction with 5 Whys, Pareto, and CPK/FPY data
- Facilitation of technical meetings with structured and collaborative analysis
- Generation of documented and auditable root cause reports
🤝 Culture of Continuous Improvement
- Inclusion of Ishikawa in standard investigation procedures (SIPOC, 8D)
- Interface with quality software or MES databases
- Training of operators and engineers in the practical application of the diagram
With AJOLLY Testing, the Ishikawa diagram is no longer just a visual tool and becomes an active technical instrument to understand and solve problems with real data and traceability.